Press
Findings written for people who have to publish tonight
Quote the sentence. Link the briefing. Do not upgrade a correlation into a law of nature.
Journalists: write to press@noosinstitute.org
Access to care
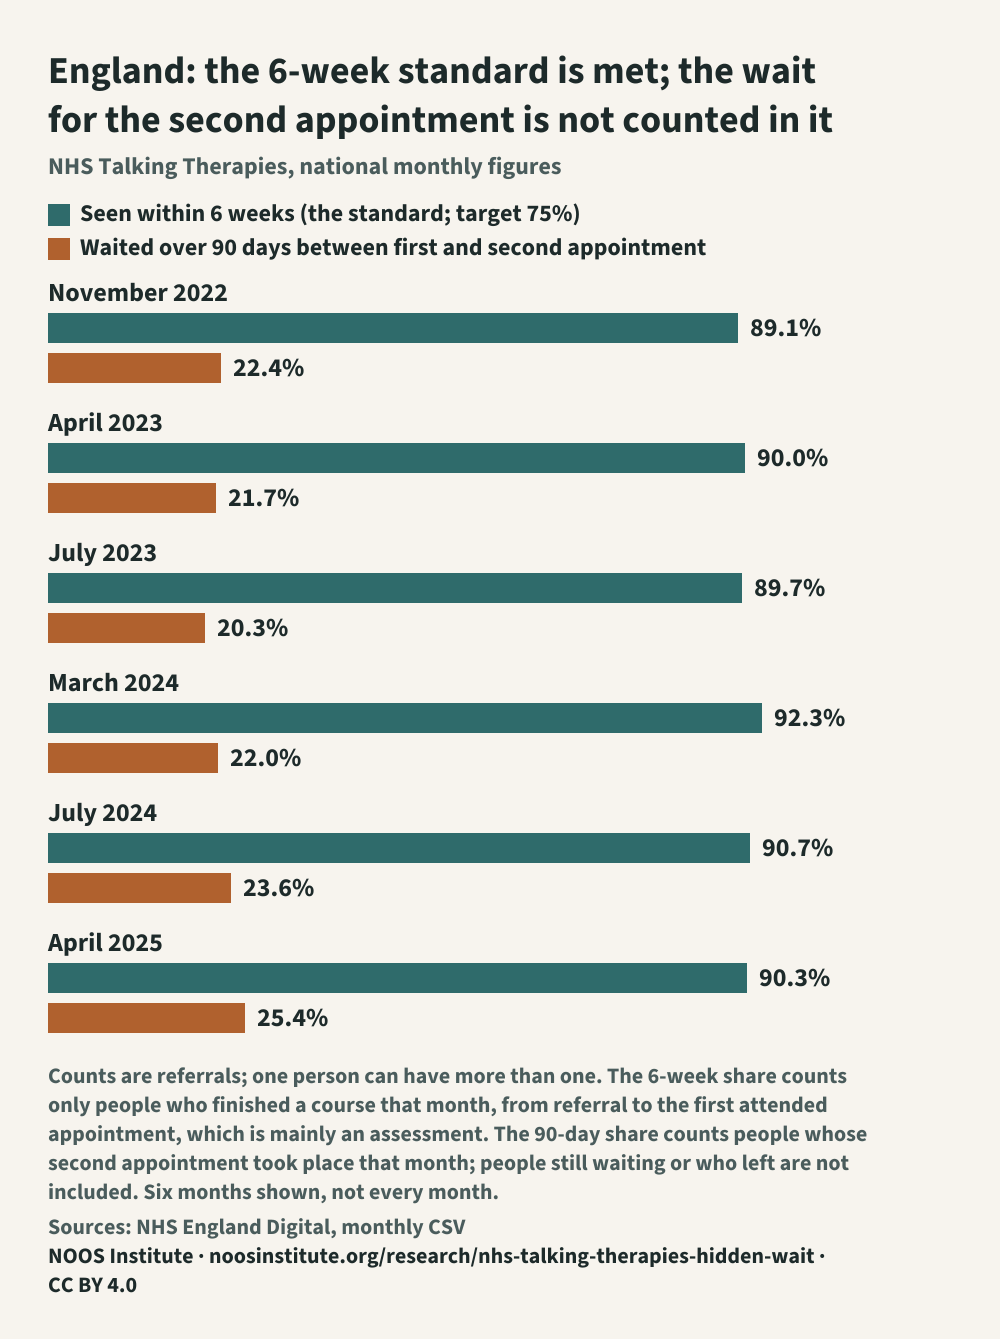
NHS Talking Therapies waiting times: 20–25% who reach a second appointment wait over 90 days for it
Quotable line
“In England, the waiting-time standard for NHS Talking Therapies (75% within 6 weeks, 95% within 18) counts the wait from referral to the first appointment, mostly an assessment, and services meet it: 89–92% within 6 weeks in the months we read. After that first appointment, between one in five and one in four of the people who reached a second appointment had waited more than 90 days for it: 22.4% in November 2022, 25.4% in April 2025. More than half had waited over 28 days (52–64%). In April 2025, the average wait from assessment to the first session of the more intensive therapy was 72 days. The standard does not see these waits.”
What this does not show: The 90-day share counts only people who had a second appointment in the month; people who gave up while waiting are not in it, so it does not show how many were lost. For some people the first appointment already includes treatment, so for them the gap is a pause in treatment rather than a wait for it to start; the data do not say which. These are national figures for one service in one country, for six months we could read, not every month. Areas and providers are not compared here. We did not show here whether a long wait after the first appointment makes people more likely to drop out or recover less. We do not claim the figure was unknown: NHS England publishes it; it is just not part of the standard.
Download: chart PNG · SVG · data CSV Free to republish with credit: NOOS Institute, CC BY 4.0.
Access to care
Alcohol use disorder: in Australia, an estimated 1 in 4 will ever seek help, the fewest of any disorder in the survey
Quotable line
“Fewer people with alcohol use disorder ever make contact with help than people with any other disorder in the Australian national survey of 2020–22: an estimated 25%, against 94% for major depressive disorder; in the year the disorder began, 2% against 35% (Birrell 2025). In a meta-analysis of 32 studies, about one in six people with alcohol use disorder received any treatment (17.3%, Mekonen 2021), and in surveys from 25 countries alcohol use disorder was the only disorder linked to lower odds of treatment in several kinds of care (Evans-Lacko 2018). Those who do make contact wait long, but not the longest: the median delay was 10 years for alcohol use disorder against 3 for major depressive disorder, but 11 for any anxiety disorder and 13 for social anxiety disorder (Birrell 2025).”
What this does not show: The Australian lifetime figures are projections: they estimate how many people would make contact by age 85 from the age at onset and at first contact that people recalled in the interview, not an observed count. "Help" or "treatment" in most of these studies means any contact, including self-help groups in some, not care that was adequate. The 25-country analysis gives odds after accounting for other disorders and severity, not shares of people, and specific phobia also had lower odds of any treatment. In the World Mental Health data, adequate treatment is reported for alcohol and drugs together, not for alcohol alone. The meta-analysis was read in its abstract; we did not see the years and countries of its studies. Eating disorders and psychoses were not part of the Australian 2020–22 survey or the 25-country analysis. None of these studies shows why people with alcohol use disorder seek help less often.
Quotable line
“On average across studies, about 6 to 9 years pass from the first mood episode to the diagnosis or treatment of bipolar disorder: 9.10 years in Keramatian 2025 and 5.8 years (95% CI 4.8 to 6.8) in Dagani 2017. These are averages across studies with different definitions of the start and the end, not one person's typical path. Years can pass both before and after the first contact with help. Before: in the US, among people who made contact later, the median wait for first contact was 6 years (Wang 2005). After: in Hungary, 6.46 years passed on average from the first presentation to any specialist mental health service to the bipolar diagnosis (Lublóy 2020; that first presentation may have been for another reason, and the authors call the figure a lower-bound estimate); a review of studies gives a median delay of 3.5 years in seeking help against 6.7 years to diagnosis (Scott 2022), but these medians come from different sets of studies.”
What this does not show: The main estimates are averages across studies, not across people, and the studies define the delay differently: Keramatian 2025 combines undiagnosed and untreated bipolar disorder, and in Dagani 2017 the delay is longer when its end is the diagnosis rather than the first treatment or hospitalization. The three medians in Scott 2022 come from different sets of studies (8, 20 and 45), and the abstract does not make clear whether they are medians of studies or of people. The US survey counts only people who later made contact with a professional. The Hungarian figure starts at first presentation to a specialist service, not at the start of the illness, and is a lower bound because electronic records begin on 1 January 2004. The patient association survey is not representative, and the two clinic studies each describe one clinic.
Access to care
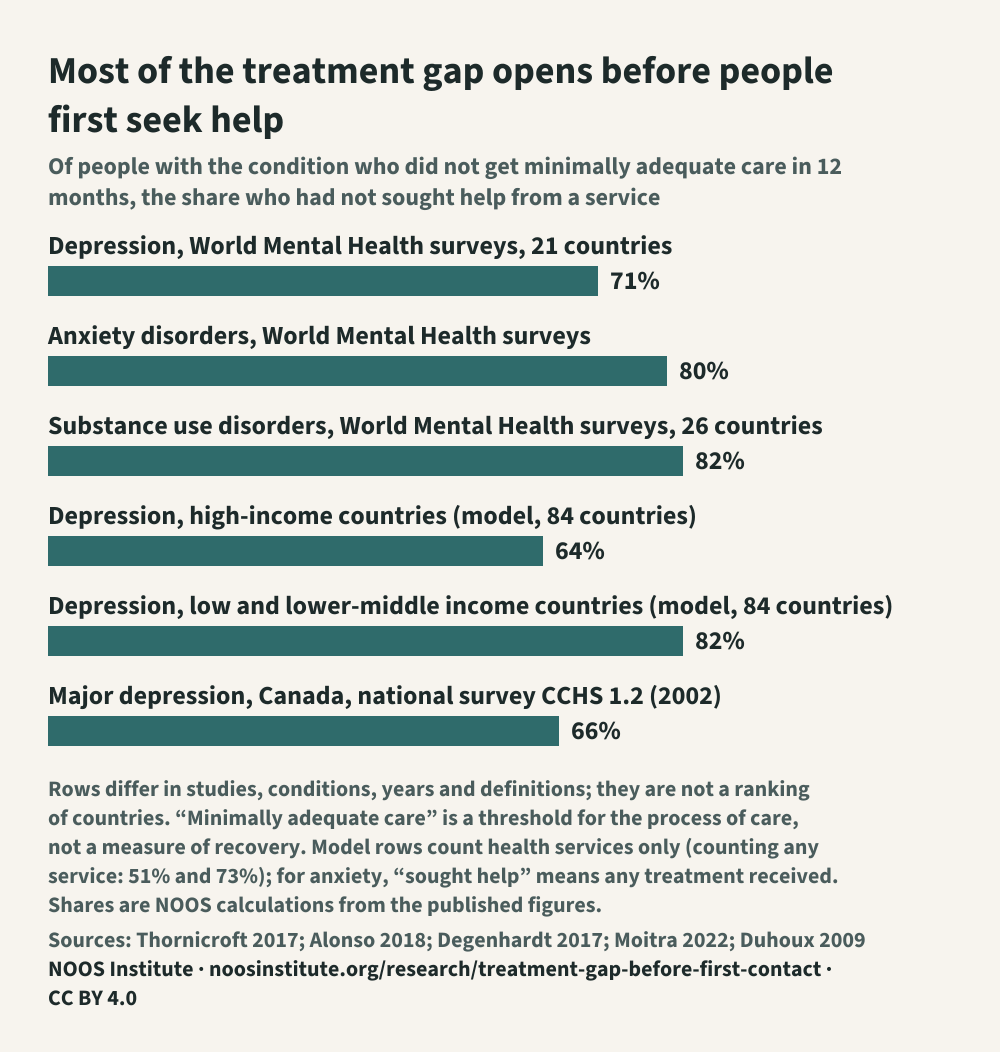
Most of the treatment gap for depression, anxiety and substance use opens before people seek help
Quotable line
“In all six cascades, most people without minimally adequate care had not reached even a first contact: 64% to 82% of the gap opens before that point (51% to 82% if any service, not only health services, counts as first contact in the pooled model). The six cascades come from three groups of sources — three from the World Mental Health surveys, two from one pooled model of 149 studies from 84 countries, and one from a national survey of Canada — and only the Canadian survey is independent of the World Mental Health surveys. The second part is weaker and depends on the country and the definition: among those who did seek help, from 29% to 85% still did not receive minimally adequate care (in Canada, care in line with national guidelines); the low end, 29%, is Canada under the softest definition.”
What this does not show: This is a recalculation of published figures, not a new study. Each cascade is a 12-month snapshot of a population, not one person’s path over time. Seeking help and adequacy come from surveys (in the model, pooled from studies) and are judged by the authors’ thresholds: they measure whether a person received a minimum of care, not whether they got better. Three of the six rows come from the same World Mental Health surveys, and the pooled model may include some of those surveys too. In the pooled model the shares are separate predictions, not nested in each other, so the subtraction is approximate; if any service at all counts as first contact, the share of the gap before first contact is 51% (high-income countries) and 73% (low and lower-middle income) instead of 64% and 82%. The Canadian data are from 2002 and one country, and the denominator of the 55% is not named in the abstract — we infer it from the numbers. The data do not say why people did not seek help or whether care was available to them.
Download: chart PNG · SVG · data CSV Free to republish with credit: NOOS Institute, CC BY 4.0.
Access to care
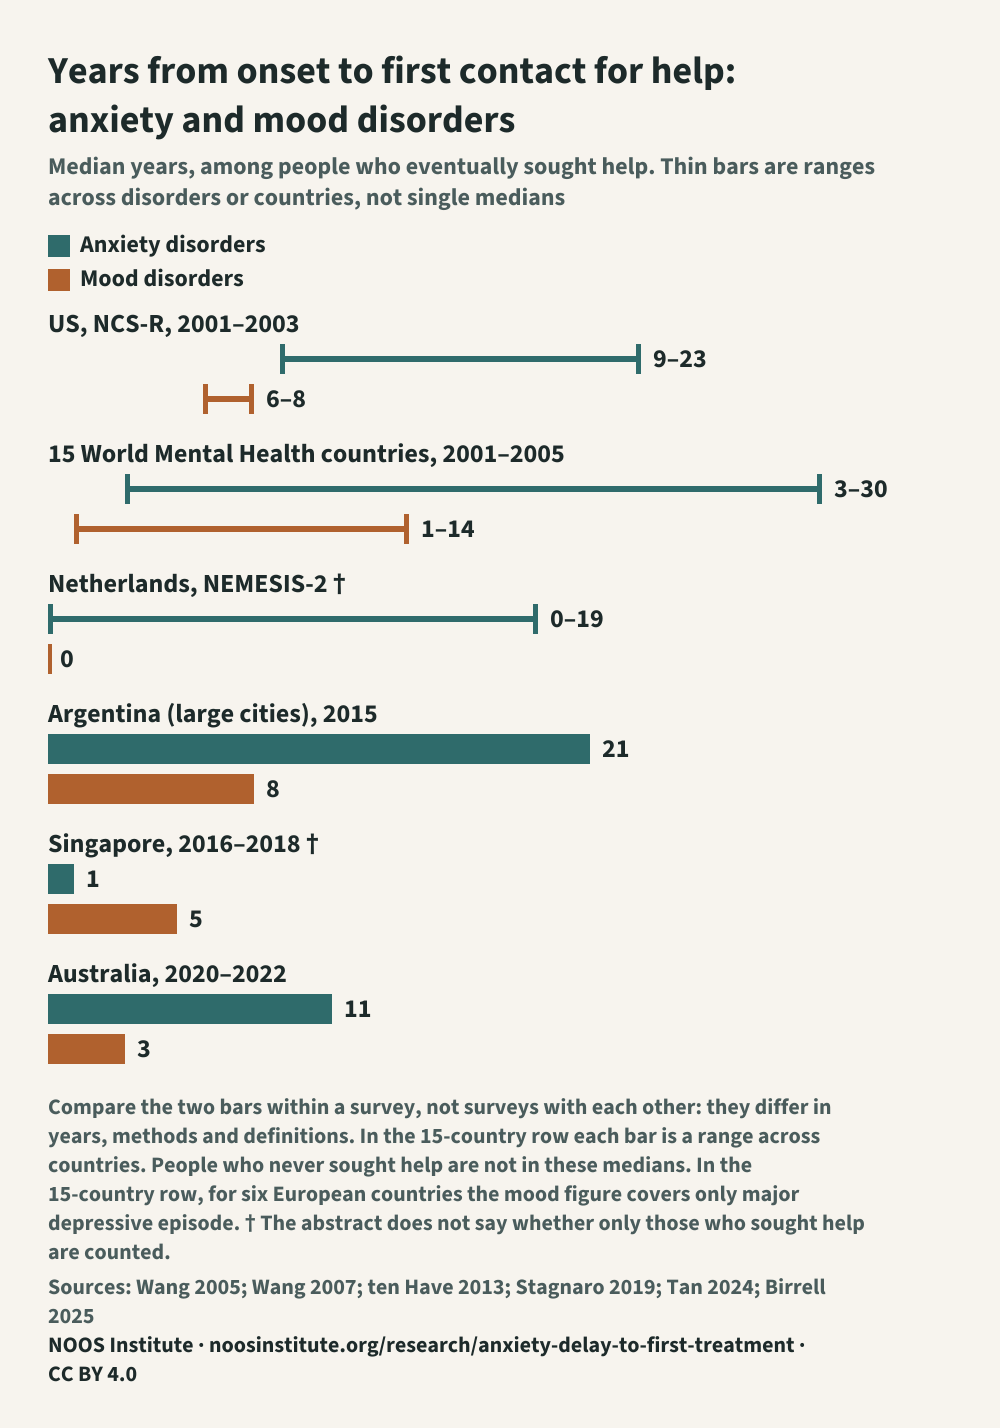
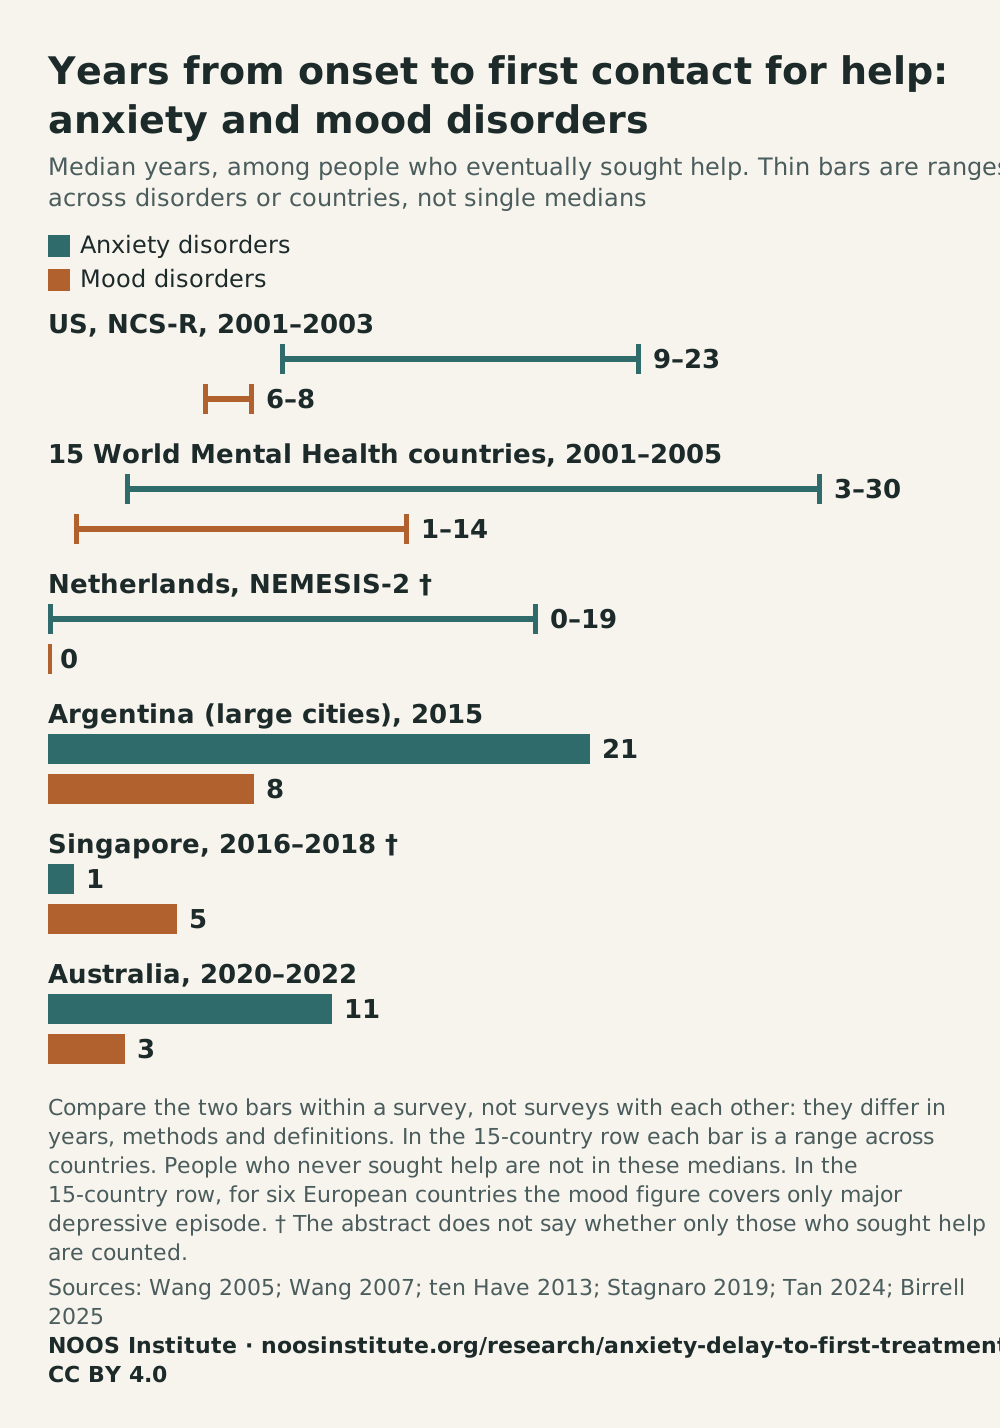
11 years from symptoms to help? Among those who sought it, it differs by disorder: anxiety 11, mood 3 (Australia, 2020–22)
Quotable line
“In Australia (2020–2022) and Argentina's large cities (2015), people with anxiety disorders who eventually sought help waited about 3.7 and 2.6 times longer than people with mood disorders; Singapore (2016–2018) shows the opposite, 1 year vs 5. Social anxiety waited 16 years or more in all three surveys we found that give a separate figure for it (the Dutch survey's abstract gives only a range across anxiety disorders) (for two of them it is not stated whether only those who sought help are counted; one is of military personnel). This does not show that anxiety itself causes the delay: only those who sought help are counted, and age of onset, which goes with longer delay and is not separated in any study we found, may explain part of the gap.”
What this does not show: Only people who eventually sought help are counted; people who never did are not in the median. An earlier start of the disorder goes with longer delay (Wang 2005, Birrell 2025; in 15 countries early onset also goes with never seeking help, Wang 2007); no study we found separates age of onset from everything else, so how much of the gap it explains is the main unproven point. There is an opposite case: in Singapore (2016–2018) the median was 1 year for anxiety and 5 for mood disorders, but only 137 people in the survey had ever sought help for a mood, anxiety or alcohol use disorder. The age of onset is recalled years later. Medians are estimated from time-to-contact curves, not observed directly. In the World Mental Health surveys a "professional" is broad: it includes counselors, spiritual advisers and traditional healers. For the Singapore, Netherlands, US NESARC and Canadian military figures, the source abstracts do not say whether the median counts only those who sought help.
Download: chart PNG · SVG · data CSV Free to republish with credit: NOOS Institute, CC BY 4.0.
Quotable line
“In Australia's 2020–22 survey, the wait before first help for depression and anxiety was long: a median of 3 years for major depressive disorder and 11 years for any anxiety disorder among those who sought help (Birrell 2025). Yet we found no controlled study in which this time was the outcome. A 2026 review of 21 systematic reviews of complex early-intervention programmes for conditions that usually begin before 25 found "no reviews" on depression or anxiety (Lee 2026), and a second review of 11 reviews, from other authors and more databases, found the time to treatment measured as an outcome only for psychosis (Adu 2026). Programmes that encourage people to seek help are the nearest step that has been tested, and for depression and anxiety the evidence is weak: a review on depression, anxiety and distress found no effect on actually seeking help (Gulliver 2012), and a meta-analysis on depressive symptoms found a borderline result its authors read as no change (Ni 2025). A broader meta-analysis of 98 trials across all mental health problems found long-term gains in seeking professional help among people with or at risk of problems, but not among children, adolescents or the general public (Xu 2018).”
What this does not show: "We found no study" means no study in PubMed, Europe PMC and the two reviews of reviews; it is not proof that none exists, and service reports outside these databases (for example from youth services or self-referral programmes) may have measured the delay. A missing test does not mean the delay cannot be shortened. Lee 2026 covered only programmes with several components for conditions that usually start before 25, and searched four databases. The Australian medians count only people who eventually sought help, and the start of the disorder is what people recalled. The 98-trial meta-analysis mixes randomised and non-randomised trials and all kinds of mental health problems, and did not measure time to help either. This page does not say what anyone should do or when to seek help.
Access to care
Duration of untreated psychosis (DUP): mean 61 weeks, median 12, among people who reached care
Quotable line
“Among people who reached care for a first episode of psychosis, the mean time to treatment was 2.6 to 6.4 times the median in the four studies in the table, Hong Kong and Japan (see the section on onset), where both are reported for the same people, so the mean describes a few long waits more than a typical one. Gradual onset went with longer waits in England, Japan and Hong Kong, and chronic onset (a category used in that study) in a US sample; sex (in schizophrenia) and ethnic group showed no difference in pooled estimates; on age, three studies found a longer wait with earlier onset and one (Denmark, ages 15–25 only) with later onset, in different samples; and models that included demographics, functioning before the illness and symptom severity explained 18–26% of the variation. This does not show that gradual onset causes the delay: onset is dated from recall, and gradual onset is harder to date.”
What this does not show: Only people who reached a service are counted; people who never reached one are not in the data at all. The start of the illness is dated from what the person and their family recall, and gradual onset is harder to date than acute onset, so part of the link between gradual onset and a long wait may come from how the wait is measured; it is an association, not a cause. The often-cited median of 14 weeks from a 2024 summary of 206 studies (Salazar de Pablo 2024) is a median of study medians, not the point that half of all people waited longer than. In one US study of 34 non-academic community clinics (RAISE-ETP, 404 people aged 15–40) and in the Danish OPUS study a long wait is not a tail but the norm: medians of 74 and 52 weeks. The data are old and uneven: the 16 studies in Boonstra 2012 were published in 1992–2009, and in Salazar de Pablo 2024 the mean was 70.0 weeks in studies from Africa and 38.6 in studies from Europe (medians 22.5 and 12.0).
Access to care
Duration of untreated psychosis: early intervention rarely shortens it, though it helps those who reach it
Quotable line
“Early intervention services help the people who reach them: in 10 randomised trials they did better than usual care on all 13 outcomes at the end of treatment, including fewer people stopping treatment (RR 0.70) and fewer hospitalisations (RR 0.74) (Correll 2018). But on average, early detection or early intervention strategies shortened the time to treatment only slightly or not measurably (Salazar de Pablo 2024; Oliver 2018), and GP education or the services alone did not shorten it (Lloyd-Evans 2011). Only one programme with a comparison group clearly did: Norway's TIPS, where a continuous public campaign together with early detection teams went with a median of 5 weeks against 16, and the delay returned to 15 weeks after the campaign stopped while the teams kept working (Melle 2004; Joa 2008). The benefit of the services is not evidence that they shorten the delay, and the Norwegian result comes from one programme in one country, with areas that were not chosen at random.”
What this does not show: Most studies in the reviews were controlled but not randomised, and they dated the start of psychosis differently; one review found that differences between studies were mostly explained by different definitions of the delay (Oliver 2018). Three of the four reviews share authors (Salazar de Pablo 2024, Oliver 2018, Correll 2018), and the independent review is from 2011 (Lloyd-Evans 2011). The benefits of early intervention services are measured among people who reached them and say nothing about how long they waited. The Norwegian result rests on one programme, in one country, from 1997, described in two reports by the same research group, with areas that were not randomised. The other programmes either had no comparison group or showed no clear effect.
Addiction
Does drinking spread through social networks, and do treatments that change a person's network help?
Quotable line
“Drinking clusters in social networks: in the Framingham study, a change in drinking among a person's relatives and friends was linked to a later change in that person's own drinking. This is clustering, not proof of cause, and the same kind of method finds the "spread" of acne and height. Treatment that changes a person's network did better than case management in one US trial and did not differ significantly from motivational therapy in a UK trial, and manualized AA and twelve-step facilitation led to more continuous abstinence at 12 months than other treatments such as cognitive behavioural therapy, in two trials pooled in a Cochrane review. None of these studies shows that drinking is caused by the network rather than by the person.”
What this does not show: This review does not show that drinking passes from person to person: the network data are observational, shared surroundings are not ruled out, and the same kind of method finds the "spread" of height. The US network-support trial is one site, and its two-year result comes from the same study, not a separate repeat. The UK trial had no untreated group, and "no difference" between two treatments does not mean they are equal. The AA evidence is strongest only for continuous abstinence, covers adults who were not forced into treatment, and many of its studies had a high risk of bias. This page does not review medication for alcohol problems.
Violence and trauma
What is known about untreated trauma and violence in cities?
Quotable line
“In the WHO World Mental Health Surveys, traumas involving interpersonal violence carried the highest risk of post-traumatic stress disorder; in a related analysis, only 48.8% of people with it in the past 12 months sought any treatment — self-reported (the survey did not ask about the quality of help), and an association rather than a cause. Childhood abuse raised the risk of later violence, but most abused children did not become violent. Some violence-prevention programmes reduced arrests or crime, mostly during the programme or for about a year; for hospital-based programmes for adults the evidence is insufficient, and Cure Violence in Chicago showed mixed results.”
What this does not show: This review does not show that untreated trauma causes violence in cities, or that therapy alone reduces homicide. It does not show that any group is violent by nature: most abused and neglected children did not become delinquent, criminal or violent. Most of the studies are from the United States, and the cross-national surveys do not compare cities with other areas (eight of the 26 covered only metropolitan areas). Figures from different studies use different samples and methods and should not be compared with each other.
Quotable line
“Some national statistics offices, such as the UK's, and global bodies now count loneliness; in the OECD's 2024 list of 49 national surveys in OECD countries (not a complete list), 39% included it. Most use one direct question or a short multi-item scale — usually three items based on the UCLA Loneliness Scale or six De Jong Gierveld items — and the wording varies. The evidence supports reading these figures as survey estimates that depend on how the question was asked.”
What this does not show: These measures are survey tools, not diagnostic tools, and for the UK three-item scale there is no accepted cutoff for who is lonely. Different sources for the same country give systematically different shares (WHO 2025). This page does not show what loneliness causes.
Quotable line
“People with weaker social ties — few contacts or feeling lonely — are more likely to die during follow-up, according to two large reviews of other researchers’ studies. The reviews do not prove that isolation causes death.”
What this does not show: This is not a NOOS study and not city policy. Isolation (few contacts) is not the same as loneliness (feeling alone). A comparison with smoking is an illustration of size from one paper, not a finding that isolation equals smoking. We did not include later WHO death-per-year counts whose method we could not check.
Quotable line
“On average, personality scales add a small amount of prediction — conscientiousness most — and show small Black–White score gaps in US data; several other methods predict better. These are averages across many jobs and studies and say nothing about any one product. Without a validation file, there is no way to check that a test predicts anything for this particular job.”
What this does not show: The figures are averages from meta-analyses, mostly measured against supervisor ratings; for many jobs the link may be near zero, and the 2022 re-analysis has published critics. Small group gaps do not rule out unfairness by disability, age, or language. Legal points cover only the United States and are not legal advice. We do not claim that all testing is oppression, or that unstructured interviews are fairer by default.
Quotable line
“After media reports of a celebrity's suicide, suicide risk rose by 13%, and when the method by which the celebrity died was reported, deaths by that method rose by 30%. In the 2020 meta-analysis these are relative risks, RR — how many times higher the risk was: 1.13 (95% CI 1.08–1.18; 14 studies) and 1.30 (1.18–1.44; 11 studies). The studies differed widely, and there were signs of publication bias, meaning that studies finding no effect are published less often. Stories of coping with a crisis were linked to fewer suicides in one Austrian study of six months of newspaper articles, and to a small drop in suicidal thoughts in trials among people vulnerable to suicide. The authors call responsible-reporting guidelines the best available population-level intervention, but their effect on deaths has not been shown. These are only associations found in observational studies, and whether media guidelines reduce suicide deaths cannot yet be said.”
What this does not show: This review does not show that news reporting causes suicide or that any single article causes a death: the death data come from observational studies, and differences between studies are large. The Austrian study of coping stories is one study at population level over six months. The trials of coping stories measured suicidal thoughts on a scale, not deaths, and the effects were small. The Vienna example is one city with a before-and-after comparison and no control. Whether media guidelines reduce suicide deaths cannot yet be said: only three studies looked at deaths.
Quotable line
“In one study across the USA, Germany, Austria and Switzerland taken together (Tran et al. 2017), statistically significant links between suicide-related search volumes and suicide rates were about as frequent as chance alone would produce (8.34% of tests against 5% expected). This rests on monthly national figures and says nothing about individuals or other countries. A forecast that used searches did better than models without search data in Ireland, but that is one small country and a forecast of counts, not of who is at risk. Search pages for searches about methods listed few help sites, and a helpline box appeared unevenly by country and by query; these are snapshots, and the effect on deaths was not measured.”
What this does not show: This review does not show whether searches can identify any individual at risk, whether search pages change what people do, or how search engines behave today. Most studies are national, monthly or yearly, and from the USA, the UK, Ireland and German-speaking Europe; search-page studies are snapshots of particular years and did not measure clicks or deaths. Reviews of the field describe which methods studies used and how they report them, not whether search data measure illness.
Quotable line
“Caregiver strain is common and measurable. In meta-analyses and one clinical review, it is linked with the conditions of care — behaviour problems of the person cared for, isolation, money stress, having had no choice — and caregivers' health is linked more closely with their own depression than with objective load; these are associations, not proof of cause. Support that improves mood exists; reliable ways to lower burden itself are still thin.”
What this does not show: Most of this evidence is observational: it shows association, not that caregiving causes poor health. Effects of support programs are small and uneven, and most trials involve dementia care. Caregiver burnout is not a diagnosis, and this page does not assess anyone.
Addiction and families
Families affected by addiction: what research knows and what it does not
Quotable line
“Living with a relative's addiction is common and stressful, and researchers treat the family member as a person under strain, not as a patient. Approaches that work with the family can raise the chance that a reluctant relative starts treatment; this measures entering treatment, not recovery, and rests on few trials, mostly about alcohol. Help for family members in their own right is still scarce and weakly tested.”
What this does not show: Most trials concern alcohol and were run in the United States; the main outcome is whether the relative enters treatment, not recovery. Studies of family members' own well-being do not compare with receiving no help. This page is not a plan of action, does not describe signs of addiction, and does not assess anyone; it does not replace professional help.
How a finding is allowed to travel
Social networks are a vehicle, not a peer review. The order is method, then a sentence a newsroom can quote, then a clip. If the clip cannot hold the limit, it does not ship.
01
The finding has to survive a method
A chart of search spikes is not a paper. Calibration against surveys, a coded SERP sample, and a sentence about what we will not claim — then it may travel. Google Flu Trends travelled first and died of overclaim.
02
Researchers and newsrooms, then social
Pickup that changes a platform or a city starts as a briefing other scientists can replicate and a journalist can quote at 16:00. Social clips are the third copy of that sentence, not the first laboratory. A reel that skips the limit line is not dissemination. It is a new rumour with our logo.
03
The win is a changed default, not a quote tweet
Other people picking it up is useful when they are a search engineer, a health ministry, a newsroom, or a lab that reruns the audit in another language. Influencers can carry the sentence if they carry the limit. Follower count is not an outcome. A help panel that was not there last year is.
Journalists: write to press@noosinstitute.org